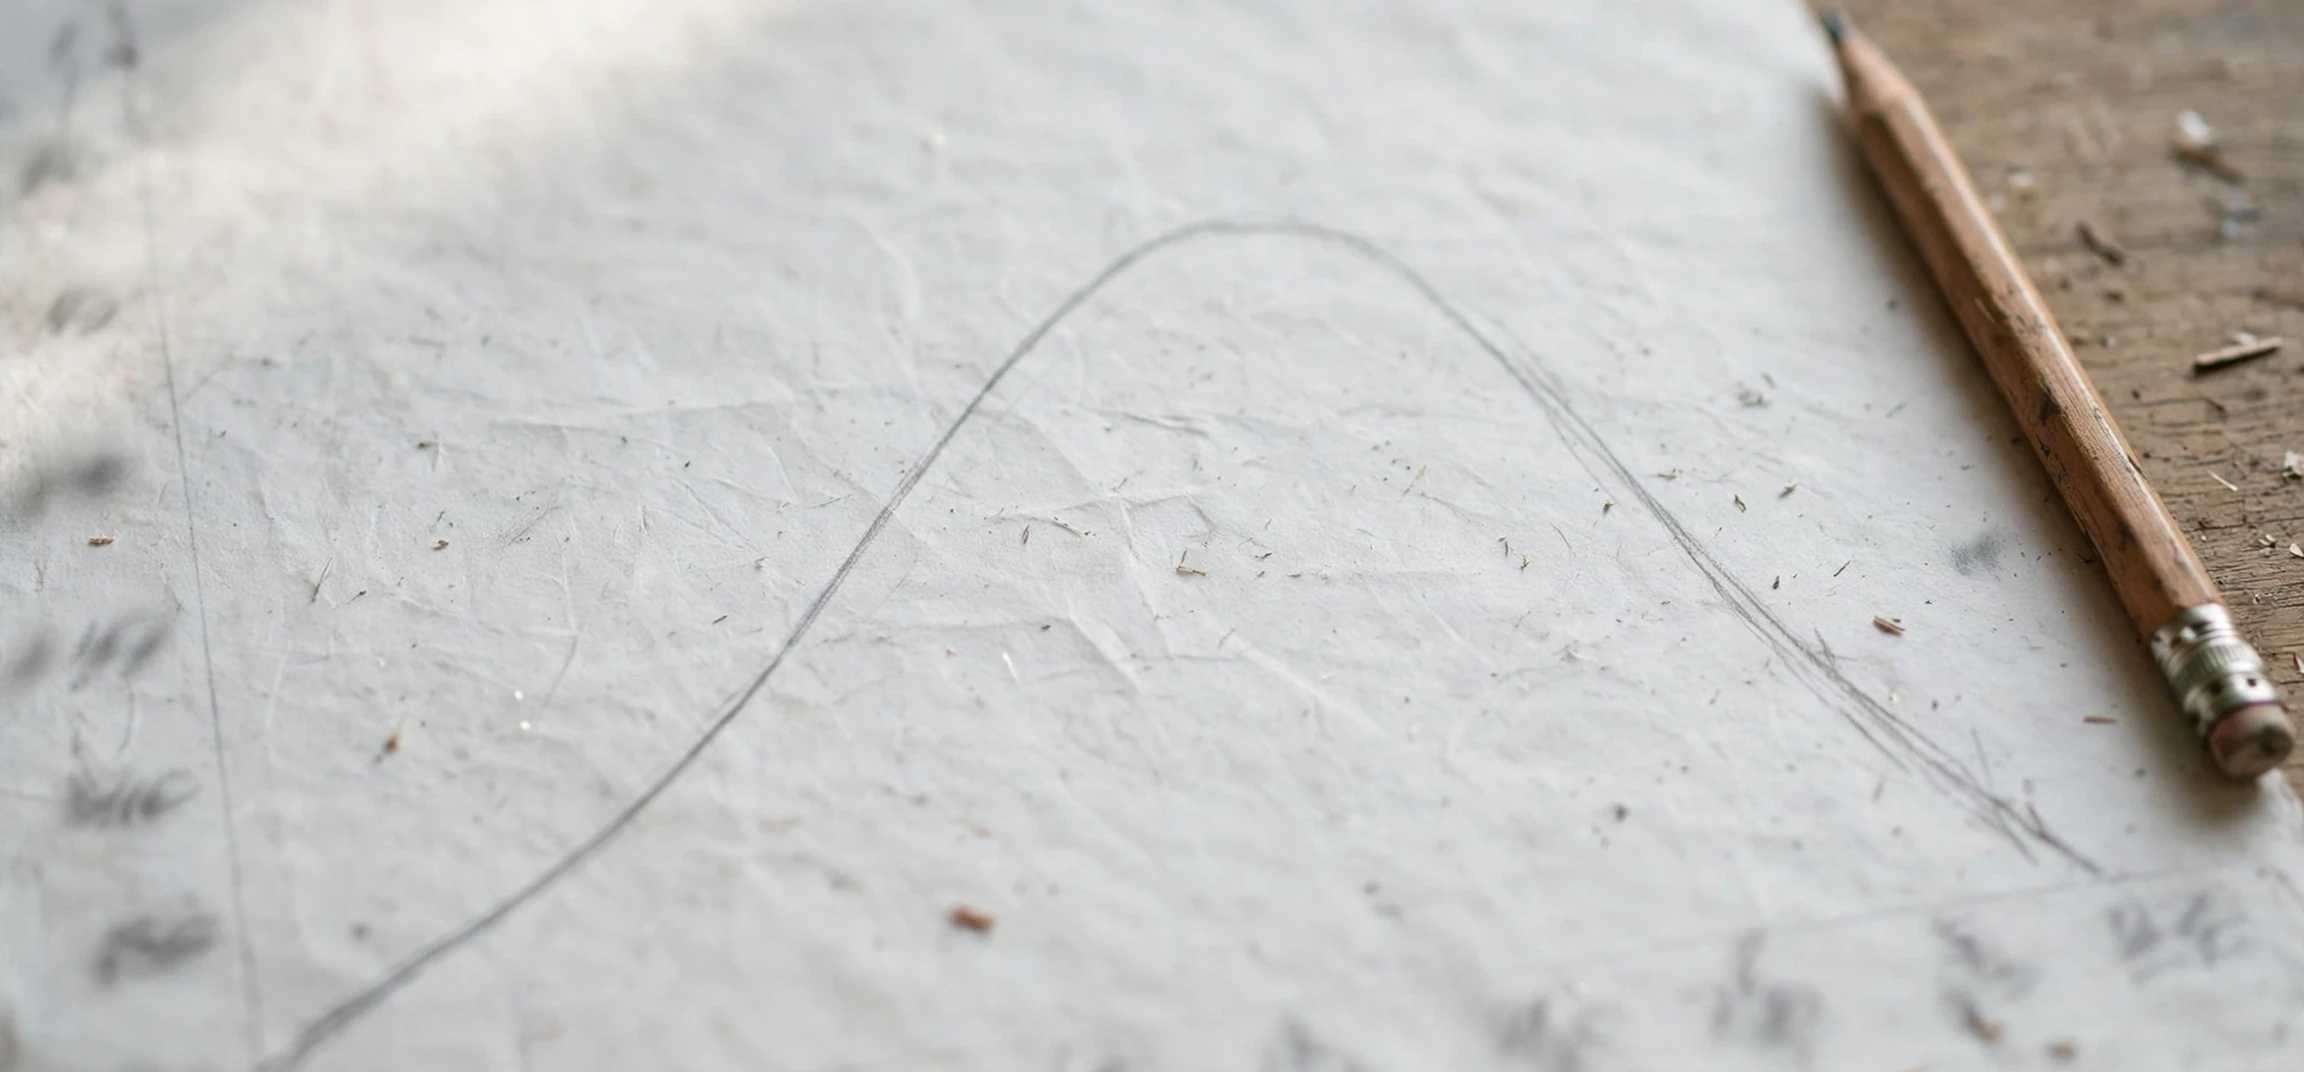
An inflexion example is one of the clearest ways to understand a concept that often sounds more complicated than it really is. In mathematics, a point of inflexion is a point on a curve where the curve changes the way it bends, switching from curving one way to curving the other way. If you have ever traced a road that bends left for a while and then begins to bend right, you have an everyday sense of what is happening. This guide explains the idea step by step, with worked examples, graphs described in words, and practical tips for spotting inflexion points in exams and real data.
Students often meet the idea of an inflexion example when studying calculus, curve sketching, or data analysis. The formal definition involves the second derivative changing sign, but the intuition is simpler: the curve stops bending in one direction and starts bending in the other. A good inflexion example makes that switch visible, whether through a simple cubic function, a graph of temperature over time, or a business chart where growth slows and then the trend changes character. By the end of this guide, you should be able to recognise, test, and explain inflexion points with confidence.
What Is an Inflexion Example in Simple Terms?
An inflexion example usually starts with a curve and a single marked point. On one side of that point, the curve is concave in one direction; on the other side, it is concave in the opposite direction. Imagine holding a flexible ruler and bending it gently. If the middle of the ruler bends upward like a smile on the left and downward like a frown on the right, the place where the bending switches is the point of inflexion. The curve itself does not stop, jump, or break there; it simply changes its bending behaviour smoothly.
It helps to separate inflexion points from turning points, because the two are often confused. A turning point is where a curve changes direction, going from rising to falling or from falling to rising. An inflexion point is different: the curve may keep rising on both sides, or keep falling on both sides, but the way it curves changes. In fact, some inflexion points are also stationary points, where the slope is zero for a moment, while others are not stationary at all. Keeping that distinction clear is the key to using any inflexion example correctly.
A Classic Inflexion Example: The Cubic Curve
The most famous inflexion example is the cubic function y equals x cubed. Its graph passes through the origin, falling from the lower left, flattening briefly, and then rising to the upper right. At the origin, the curve changes from concave down to concave up, which makes the origin a point of inflexion. The slope at that point is zero, so it is also a stationary point of inflexion, sometimes called a horizontal point of inflexion. This single example teaches several lessons at once: an inflexion point need not be a peak or a trough, and a zero slope does not automatically mean a maximum or minimum.
To test this inflexion example using calculus, find the second derivative. For y equals x cubed, the first derivative is 3x squared and the second derivative is 6x. The second derivative is negative when x is negative and positive when x is positive, so it changes sign at x equals zero. That sign change is the formal test for a point of inflexion. It confirms what the graph shows: the bending switches direction at the origin. Whenever you work through an inflexion example, checking the sign of the second derivative on both sides of the candidate point is the most reliable method.
A Shifted Cubic as a Second Inflexion Example
Consider y equals (x minus 2) cubed plus 1. This is the same basic shape shifted right by two units and up by one unit, so its point of inflexion moves to the coordinates (2, 1). The second derivative is 6(x minus 2), which changes sign at x equals 2. This inflexion example is useful because it shows that the inflexion point is not always at the origin, and that shifting a graph moves the inflexion point along with it. In exam questions, recognising a shifted cubic quickly can save time and prevent errors.
Another helpful variation is y equals negative x cubed. Here the graph falls from the upper left to the lower right, and the point of inflexion is still at the origin, but the concavity changes in the opposite order, from concave up to concave down. Comparing these two versions side by side is a strong study technique: the same point can be an inflexion point in both cases, while the direction of the switch is reversed. Paying attention to the order of the change helps you describe any inflexion example accurately in words.
An Inflexion Example That Is Not a Stationary Point
Not every inflexion example involves a flat tangent. Consider a curve that is rising throughout but changes from bending downward to bending upward partway along. At the switching point, the slope is positive, not zero, so the curve passes through the point while still climbing. This is called a non-stationary point of inflexion. It is a good reminder that inflexion is about curvature, not about the slope being zero. Many real-world graphs behave this way: a quantity keeps increasing, but the rate of increase first slows and then quickens, or vice versa.
A concrete illustration comes from population or sales data. Suppose a product’s total sales climb steadily, but early growth is rapid, then slows for a period, then quickens again. The point where the bending of the cumulative curve changes marks a shift in the underlying pattern, even though sales never fall. Analysts look for such points because they can signal a change in conditions, such as a new marketing campaign taking effect or a market becoming saturated and then opening up again. This is why the idea behind an inflexion example matters well beyond the mathematics classroom.
How to Find a Point of Inflexion Step by Step
Finding a point of inflexion follows a clear sequence. First, differentiate the function twice to obtain the second derivative. Second, solve the equation formed by setting the second derivative equal to zero, which gives candidate points. Third, test the sign of the second derivative on either side of each candidate: if the sign changes, you have a genuine point of inflexion; if it does not change, you do not. Finally, substitute the x-value back into the original function to find the corresponding y-value, giving the full coordinates of the point.
It is important not to skip the sign-change test. Setting the second derivative to zero only produces candidates, and some candidates turn out not to be inflexion points at all. For instance, the function y equals x to the power of four has a second derivative of 12x squared, which is zero at x equals zero but does not change sign there, since it is positive on both sides. The origin is a minimum for that function, not a point of inflexion. This cautionary inflexion example, or rather non-example, appears frequently in textbooks precisely because it catches out students who stop at the second step.
Worked Inflexion Example With Full Working
Let us work through a fuller inflexion example: y equals x cubed minus 3x squared. The first derivative is 3x squared minus 6x, and the second derivative is 6x minus 6. Setting the second derivative to zero gives x equals 1. Testing either side, the second derivative is negative when x is less than 1 and positive when x is greater than 1, so the sign changes and x equals 1 is a genuine point of inflexion. Substituting back, y equals 1 minus 3, which is negative 2, so the point of inflexion is (1, negative 2). Writing out each step like this, rather than jumping to the answer, is the habit that earns full marks.
You can also sketch the behaviour around this point to double-check your result. To the left of x equals 1, the curve is concave down; to the right, it is concave up. The curve passes through (1, negative 2) while falling, since the first derivative at x equals 1 is negative 3. This is a non-stationary point of inflexion, because the slope is not zero there. Noting whether the point is stationary or non-stationary, and whether the curve is rising or falling through it, turns a bare answer into a complete description.
An Inflexion Example in Real-World Data
Beyond pure mathematics, an inflexion example appears whenever a trend changes its curvature. In economics, a cost curve or a growth chart may bend one way during an early phase and the other way later, marking a shift in the underlying forces. In science, a temperature or reaction-rate graph may show a similar switch when conditions change. In everyday language, people even speak of an inflexion point in a career, a company, or a technology, meaning a moment after which the direction of change itself changes character. The mathematical idea gives that metaphor its precision.
Consider a city tracking total journeys on a new transport line. Early on, growth may accelerate as word spreads; later, growth may slow as the market matures. The cumulative chart bends upward more steeply, then less steeply, and the switch between those phases is a point of inflexion. Planners care about that point because it tells them when the phase of rapid take-up has ended and a steadier phase has begun. The same logic applies to learning curves, adoption curves, and many other S-shaped patterns, where the middle of the S is often the inflexion point.
Common Mistakes When Using an Inflexion Example
Several mistakes recur when students work with inflexion points. The first is confusing an inflexion point with a turning point, as discussed earlier. The second is assuming that a zero second derivative guarantees an inflexion point, without testing for a sign change. The third is forgetting to find the y-coordinate, leaving the answer as an x-value only. The fourth is describing concavity backwards, calling a smile-shaped section concave down or a frown-shaped section concave up. A quick sketch, even a rough one, usually prevents these slips.
Another common error is mixing up the terms inflexion and inflection. Both spellings appear in English, with inflexion more common in British usage and inflection more common in American usage, but they refer to the same concept in mathematics. In an exam, either spelling is normally accepted, but consistency matters for clarity. If your course uses one spelling, follow it throughout your answer. The underlying mathematics, the sign change of the second derivative, is identical whichever spelling you choose.
| Function | Second derivative | Point of inflexion | Stationary? |
|---|---|---|---|
| y equals x cubed | 6x | (0, 0) | Yes, horizontal |
| y equals (x minus 2) cubed plus 1 | 6(x minus 2) | (2, 1) | Yes, horizontal |
| y equals x cubed minus 3x squared | 6x minus 6 | (1, negative 2) | No, slope is negative 3 |
| y equals x to the power of four | 12x squared | None at the origin | Yes, but it is a minimum |
Frequently Asked Questions
What is a point of inflexion in one sentence?
A point of inflexion is a point on a curve where the concavity changes, so the curve switches from bending one way to bending the other way. Any good inflexion example shows that switch clearly, either on a graph or through a sign change in the second derivative.
How do you test for a point of inflexion?
Find the second derivative, set it to zero to locate candidates, and then check whether its sign changes on either side of each candidate. A sign change confirms a point of inflexion; no sign change means the candidate is not one. Finally, find the y-coordinate from the original function.
Must a point of inflexion be stationary?
No. Some points of inflexion are stationary, with a horizontal tangent, while others are non-stationary, where the curve passes through with a positive or negative slope. The defining feature is the change in concavity, not the value of the slope.
Where does an inflexion example appear outside mathematics?
It appears in growth charts, adoption curves, cost curves, and any cumulative trend that changes from accelerating to decelerating or back again. The middle of an S-shaped curve is very often a point of inflexion, marking a shift in the phase of growth.
Conclusion
An inflexion example is at its most useful when it makes the change in bending visible and testable. The cubic curve y equals x cubed gives the classic stationary case, a shifted cubic shows how the point moves, and a curve like y equals x cubed minus 3x squared shows a non-stationary case with full working. The reliable test is always the same: a sign change in the second derivative, followed by the full coordinates of the point. Keep that method in mind, sketch roughly as you work, and do not confuse inflexion points with turning points or with mere candidates where the second derivative is zero. For more explanations of tricky terms, see our guides on all-encompassing meaning, the meaning of marginalized, and bildungsroman meaning.