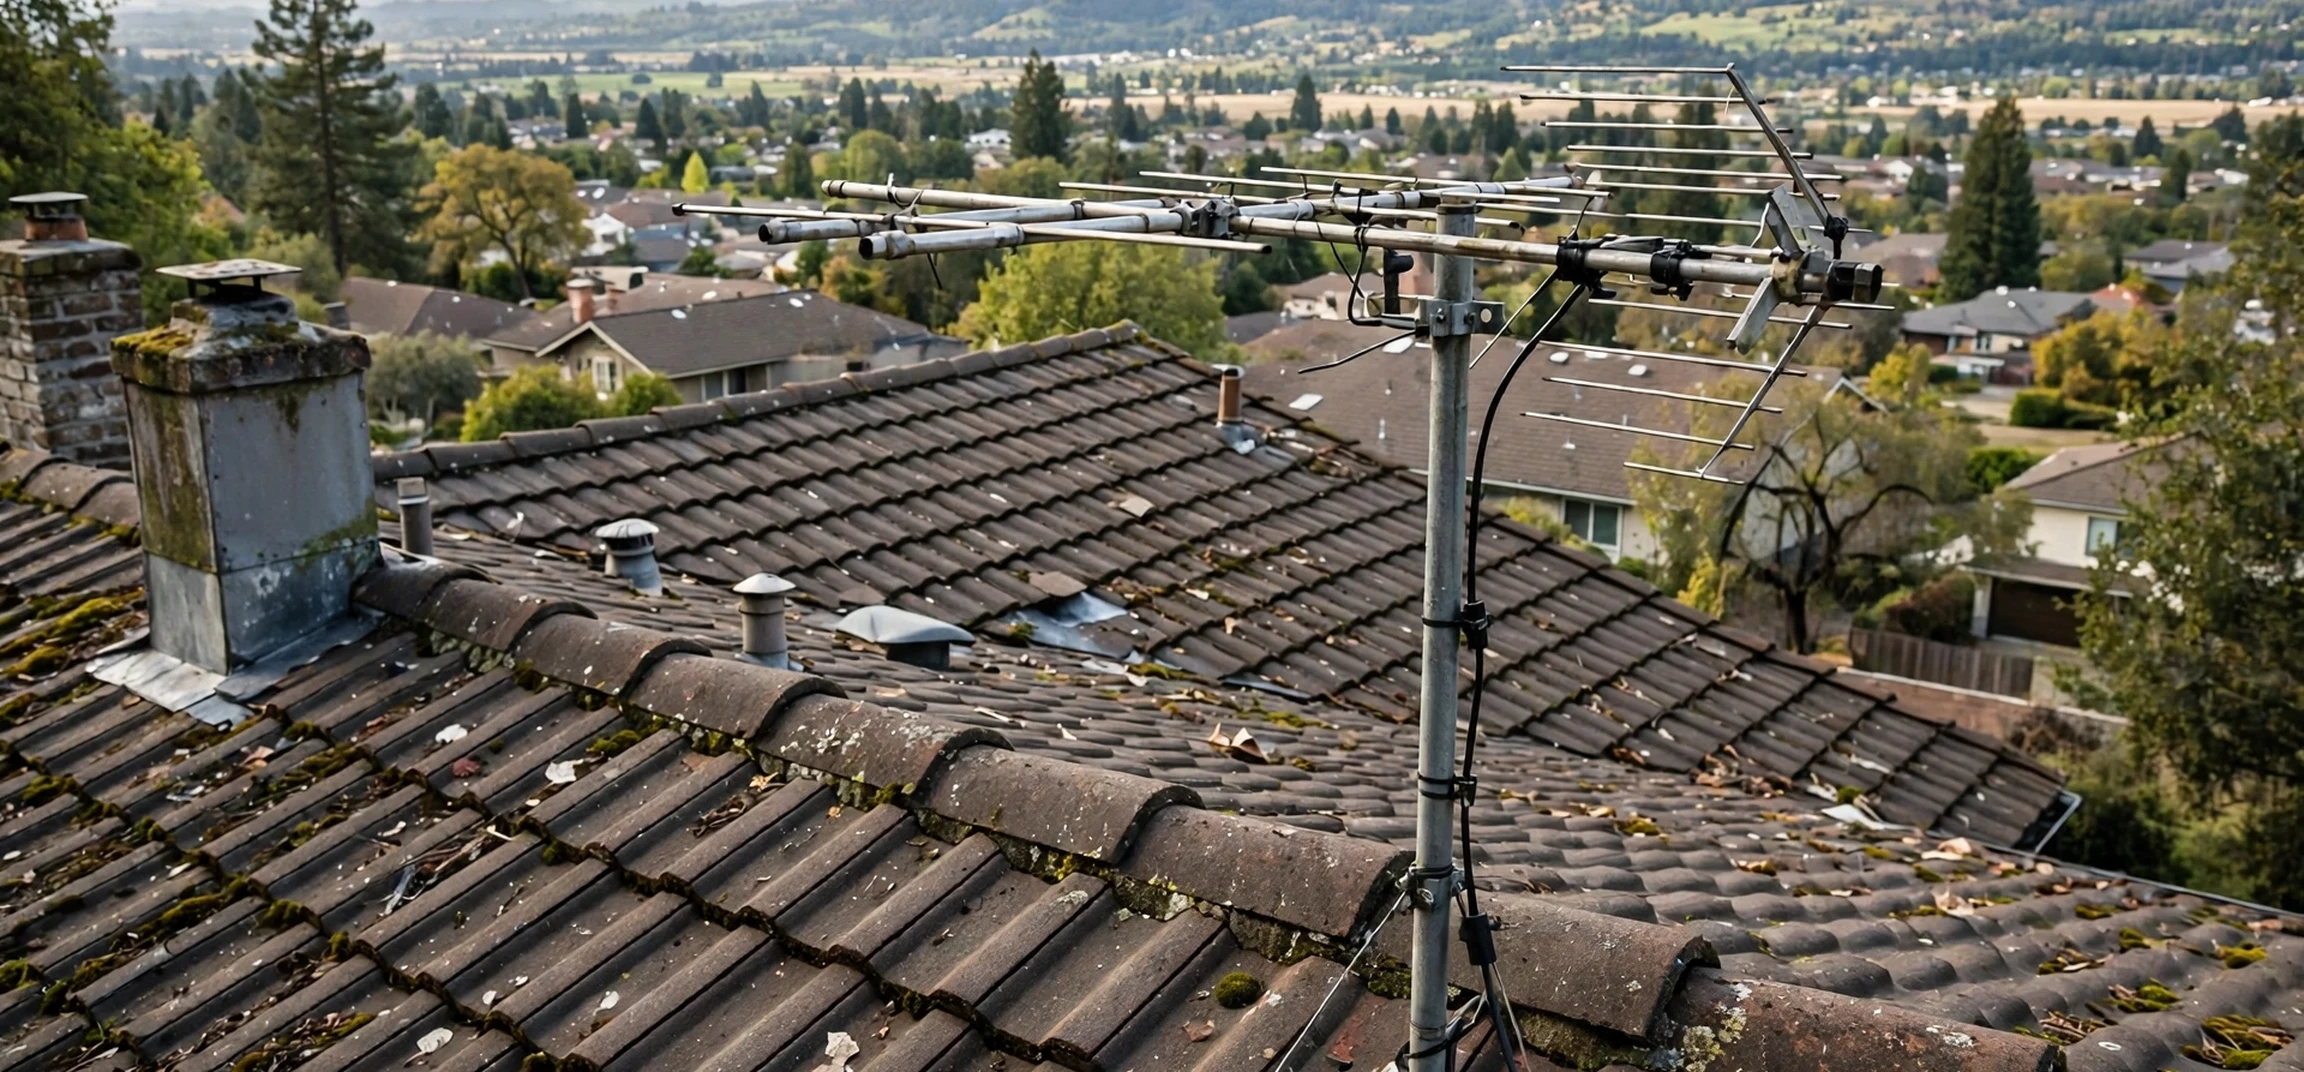
If you use an antenna for free over-the-air television, you have probably heard advice to check a map before you buy equipment or climb onto the roof. That advice points to dtv reception maps, the tools that predict which digital television signals should reach your address and how strong they should be. These maps turn an invisible world of broadcast towers, terrain, and signal physics into a readable picture: coloured zones, station lists, and signal-strength estimates that help you choose an antenna and point it in the right direction.
This guide explains what reception maps are, how they are made, how to read them, and where their limits lie. It covers the official sources in words only, so you can find them through the regulator and broadcaster channels you already trust, and it explains the practical steps that turn a map prediction into a working antenna setup.
DTV Reception Maps Explained
dtv reception maps are prediction tools for digital terrestrial television. You enter a location, and the tool estimates the broadcast signals available there, usually listing each station with its channel, network affiliation, distance and direction from your location, and a predicted signal strength. Some tools display this as a coloured coverage map, with strong areas in one colour and fringe areas in another, while others present a ranked table that is easier to use when choosing an antenna.
The word prediction matters. A reception map does not measure the signal at your rooftop in real time. It calculates an estimate from known transmitter locations, power levels, antenna heights, terrain data, and propagation models that describe how radio waves travel. That estimate is usually good enough to guide equipment choices, but it cannot account for every local detail, such as a new building, a dense tree line, or the metal roof over your living room.
Digital television differs from the old analogue system in an important way. Analogue pictures degraded gracefully, growing snowy as the signal weakened. Digital pictures stay perfect until the signal falls below a threshold, then break up or vanish entirely. This cliff effect makes prediction more valuable, because the difference between a working channel and a missing one can be small, and a map helps you understand which channels sit near that edge before you invest in hardware.
How DTV Reception Maps Are Made
Reception maps start with transmitter data. Regulators licence broadcast stations with specific frequencies, power levels, antenna heights, and locations, and that information feeds the models. Terrain data adds hills, valleys, and the curvature of the earth, all of which bend, block, or reflect signals. Land-cover data can add further detail about forests and built-up areas that absorb or scatter radio waves.
The model then calculates predicted field strength at many points across a region, producing the coloured zones you see on a map. Engineers validate these models against field measurements, but no model is exact everywhere, because radio propagation depends on weather, seasonal foliage, and local reflections that change over time. Think of a reception map as a weather forecast for television signals: highly useful for planning, but not a guarantee for a specific rooftop at a specific hour.
Different tools use different models and assumptions, which is why two maps can disagree slightly for the same address. One tool may assume a rooftop antenna at a standard height, while another assumes an indoor antenna or a different receiver sensitivity. When results differ, check the assumptions behind each tool rather than assuming one is simply wrong. The most useful comparison is between tools that state their antenna-height assumption clearly.
Reading DTV Reception Maps Correctly
Start with the station list, not just the colours. A good result lists each receivable station with its real broadcast channel, which is the frequency the station actually transmits on, and its virtual channel, which is the number displayed on your television. These often differ, because stations kept their familiar numbers after the digital transition even when their frequencies changed. Knowing both numbers helps when you rescan your television or troubleshoot a missing channel.
Next, look at signal strength and direction. Strength is often described in words such as strong, moderate, weak, or fringe, sometimes with a numeric field-strength value for technical users. Direction is given as a compass bearing from your location to the transmitter. If most of your wanted stations cluster in one direction, a directional antenna pointed that way works well. If stations come from several directions, you may need a multi-directional antenna, a rotator, or a compromise aim that favours the weakest wanted station.
Distance matters, but it is not the whole story. A station fifty miles away across flat ground can be easier to receive than a station twenty miles away behind a hill. That is why maps combine distance with terrain rather than ranking by distance alone. Pay attention to any terrain or obstruction notes in the tool output, and treat a distant station with a clear path as more promising than a nearer station blocked by high ground.
What the Map Colours Mean
Coverage maps typically use a gradient from strong to weak. The strongest zone, usually near transmitters, should work with almost any antenna, including indoor models. The middle zones generally need a rooftop or attic antenna. The outer fringe zones may need a larger, higher antenna and careful aiming, and some channels there may only work in favourable conditions. Colours are a planning aid, not a promise, so use them to narrow your choices and then test with real equipment.
Using DTV Reception Maps to Choose an Antenna
Your map result should drive three antenna decisions: type, size, and height. Indoor flat antennas suit strong-signal areas and renters who cannot mount outdoor equipment. Attic antennas suit moderate areas where an outdoor mount is impractical but a higher, sheltered position is available. Outdoor rooftop antennas suit moderate-to-fringe areas and give the best performance, because height clears local obstructions and distance from household interference improves reception.
Frequency band is the second decision. Television broadcasts use VHF and UHF bands, and some stations sit in each. A map result that shows stations on both bands calls for a combined antenna, while a result with only UHF stations allows a UHF-only design. Check the real channel numbers in your result against the antenna specification, not just marketing claims about range. A claimed range figure without band information is not a reliable guide.
Height is often more valuable than size. Raising an antenna by a few feet can clear a roofline, a tree, or a neighbouring building and transform reception. If a map shows borderline signals, prioritise a higher mount and a clear line toward the transmitters before buying a larger antenna. A mast, a chimney mount, or a gable mount can all help, provided the installation is safe and follows local rules.
Broadcast schedules and channel lineups change over time, so a reception map is best used alongside current programme information. For a sense of how local schedules are organised, our guide to the Bend television guide and most-watched listings illustrates how station lists translate into daily viewing choices.
Practical Steps From Map to Working Channels
Begin by running the official reception tool for your exact location, using your full address as the tool requests it, and save or print the station list. Note the direction of your most-wanted stations and whether they share a bearing. Then choose an antenna type that matches the weakest wanted station, not the strongest, because a setup that only receives strong stations will disappoint you on the channels you actually care about.
Install the antenna with a clear view toward the transmitters, connect it with good-quality coaxial cable, and keep cable runs as short as practical, since long runs lose signal. Use a masthead amplifier only if the map and your tests show weak signals or long cable runs; amplifiers boost noise as well as signal and can overload strong-signal setups. After installation, run a full channel rescan on your television, and repeat the scan after any aiming adjustment, because televisions only list channels found during the most recent scan.
If some channels are missing, work methodically. Check connections, try small aiming adjustments, and rescan after each change. Try a higher position before a bigger antenna. Check whether the missing station shares a direction with working stations, which points to a frequency-band issue, or comes from a different direction, which points to an aiming compromise. Note weather and time of day, since tropospheric conditions can temporarily extend or disrupt fringe reception.
Indoor Antennas and Map Predictions
Maps usually assume an outdoor antenna at a standard height, so indoor results will be worse than the map suggests, especially in middle and fringe zones. Building materials matter: wood and plaster pass signals far better than metal, concrete, and foil-backed insulation. If you must use an indoor antenna, place it near a window facing the transmitters, away from electronic interference, and test several positions before concluding that a channel is unavailable.
Limits and Common Misunderstandings
The most common misunderstanding is treating a map as a reception guarantee. A strong prediction can still fail behind a new building or under a metal roof, and a weak prediction can succeed with a high, well-aimed antenna. Maps guide your starting point; your rooftop test is the final answer. Similarly, a neighbour success story is encouraging but not decisive, because antenna height, building materials, and exact position vary from house to house.
Another misunderstanding concerns channel numbers. After rescans and frequency changes, a station may move its real broadcast channel while keeping its displayed number. If a familiar channel vanishes, rescan before assuming the station closed, and check broadcaster notices about frequency moves. Reception tools are updated to reflect licenced changes, but your television only learns about them through a fresh scan.
Finally, remember that reception maps cover terrestrial broadcast television only. They do not describe cable, satellite, or internet streaming availability, and they do not rank programme quality. They answer a narrow, practical question: which broadcast signals should reach this location, and how strong should they be? Used within that scope, they are one of the most useful free planning tools available to antenna viewers.
Programme discovery is a separate step from signal prediction. Once your antenna works, guides such as our Boomerang television channel schedule show how individual channels organise their daily lineups, which is the payoff for getting the antenna setup right.
| Map signal level | Typical antenna starting point | Notes |
|---|---|---|
| Strong | Indoor or small outdoor antenna | Most positions should work |
| Moderate | Attic or rooftop antenna | Height and aiming matter |
| Weak | Larger rooftop antenna | Prioritise height and clear view |
| Fringe | High rooftop antenna, careful aiming | Some channels may vary with conditions |
Frequently Asked Questions
Does a good map result guarantee reception?
No. Maps are predictions based on transmitter, terrain, and propagation models. Local buildings, trees, roofing materials, and antenna position can shift the real result, so treat the map as a planning guide and test on your roof.
Where can I find an official reception map?
Use the reception tool published by the national broadcast regulator for your country, found through that regulator official website and its consumer television section. Broadcaster organisations also publish coverage information for their own stations through their official channels.
Why did a channel disappear after working for months?
Possible causes include a frequency move, a transmitter change, new local obstructions, antenna or cable faults, and seasonal propagation changes. Rescan your television, check broadcaster notices, and inspect your antenna and cabling.
Do I need an amplifier?
Not always. Amplifiers help weak signals and long cable runs, but they can overload strong signals and worsen reception. Try without one first, and add one only if tests show weak signals after correct aiming and height.
Conclusion
dtv reception maps turn invisible broadcast geography into a practical plan: which stations to expect, how strong they should be, which direction to aim, and what kind of antenna to start with. Use the official regulator tool for your location, read the station list rather than just the colours, match your antenna to the weakest station you want, and test methodically on your own roof. With that approach, free over-the-air television becomes a reliable part of your viewing mix rather than a guessing game. For broader scheduling context once your setup works, see our overview of the CBS Monday night television lineup.