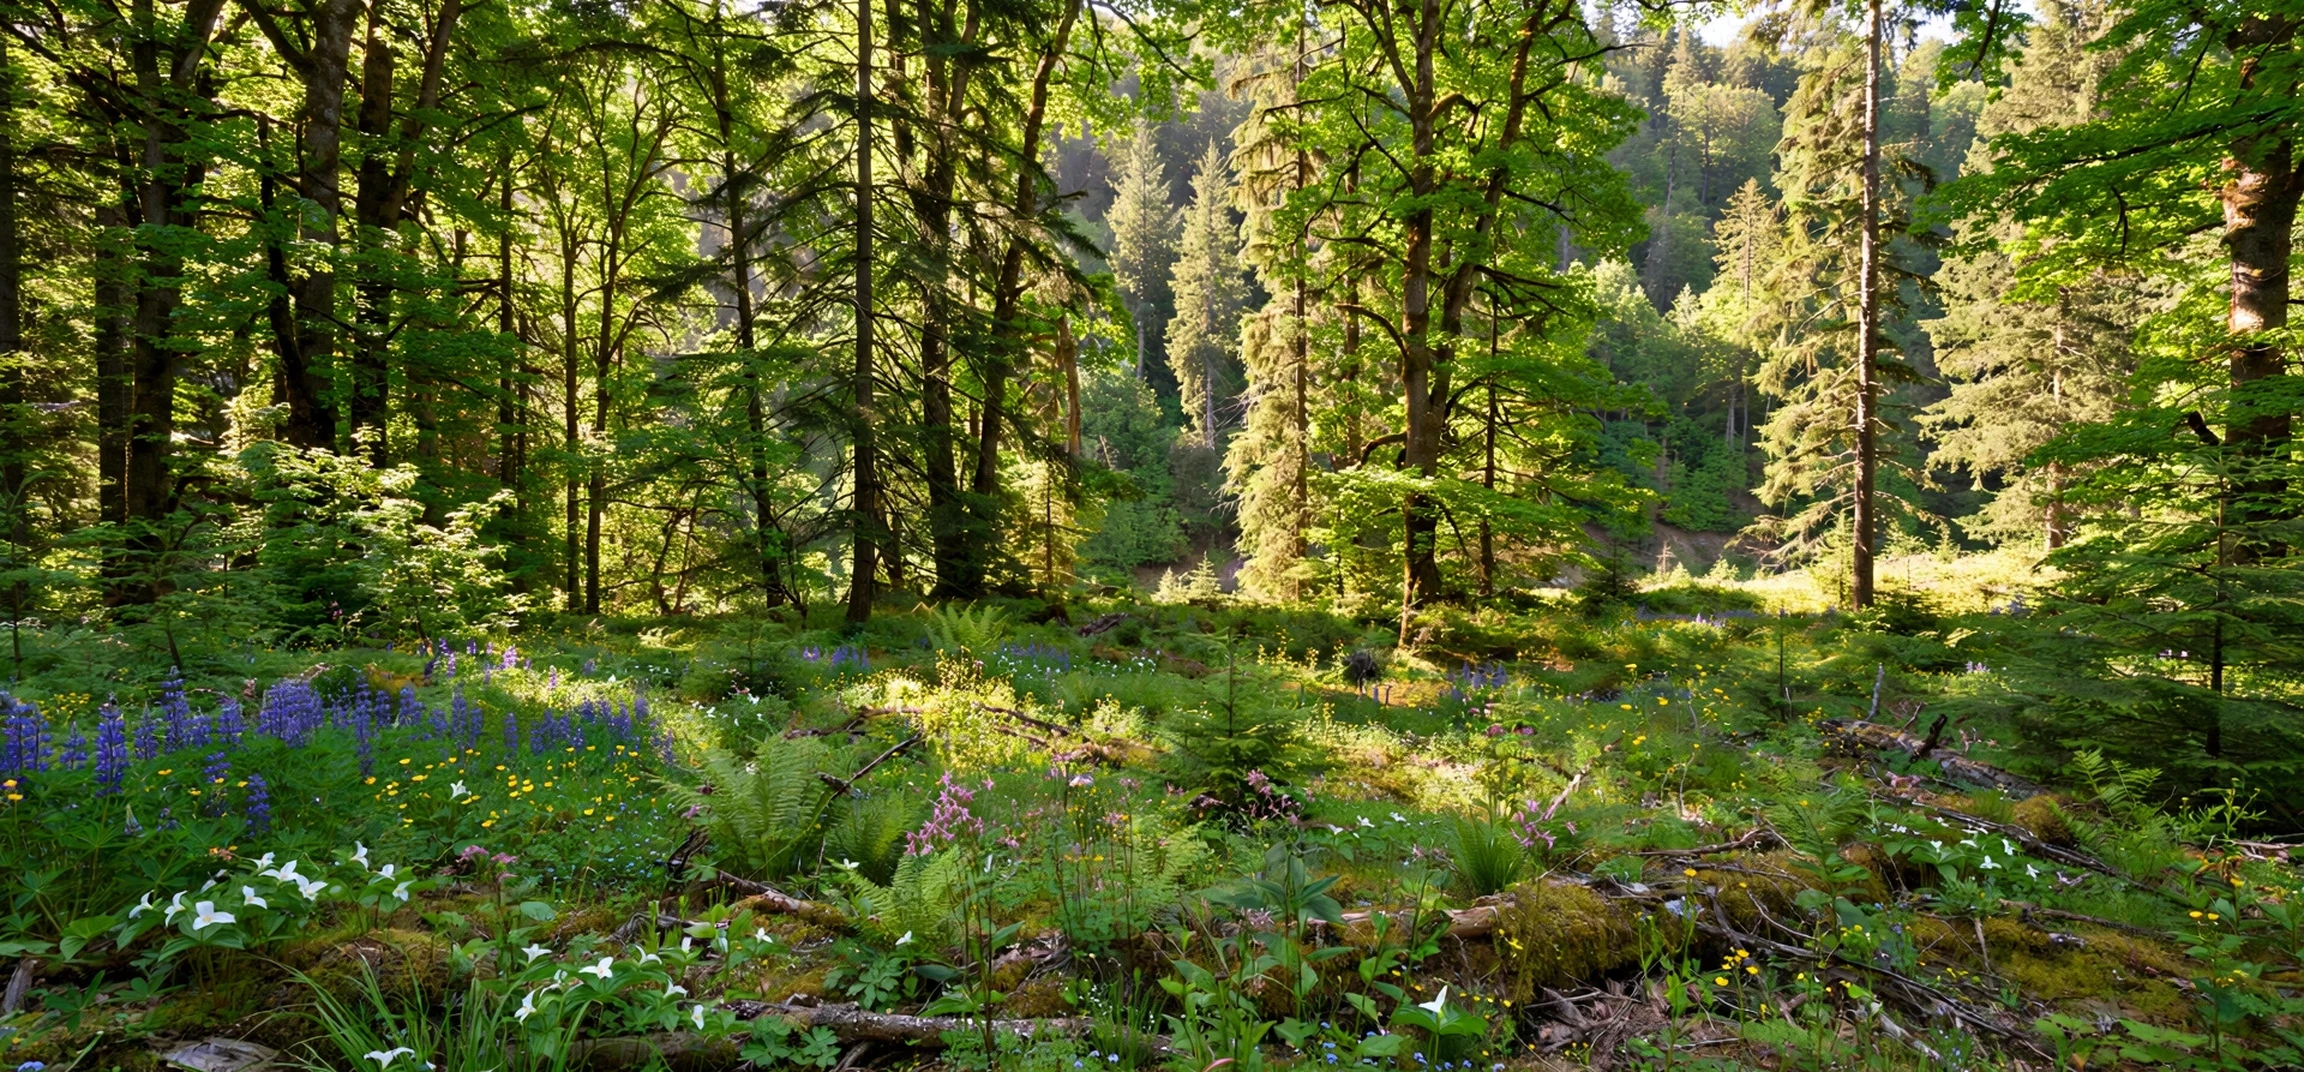
People who search for definition species diversity often want more than a dictionary meaning: they want to know how scientists actually measure it. After all, saying a forest is “diverse” is only useful if the claim can be checked, compared, and repeated. This guide takes a deliberately different angle from a basic explainer. It focuses on measurement: how ecologists count species, how they judge evenness, which indices they use, and why the definition species diversity only becomes a practical tool once it is measured carefully.
Measurement matters because impressions mislead. A loud dawn chorus can suggest a rich bird community, while a quiet woodland may hold more species that simply call less often. A colourful meadow may be dominated by a few showy flowers, while a plain-looking grassland hides dozens of less visible plants. Without a method, two observers can visit the same place and reach opposite conclusions. With a method, their results can be compared, and change over time becomes visible rather than a matter of opinion.
This article walks through the full measuring process in plain language. It explains species richness and evenness as the two building blocks, introduces the Shannon and Simpson indices without heavy mathematics, covers sampling methods from quadrats to camera traps, and discusses the traps that can distort a result. It also explains why measurement matters for conservation decisions, where limited money must go to the places and actions that protect the most life.
Definition Species Diversity: From Meaning to Measurement
The definition species diversity describes the variety of species in a community, combining how many species are present with how evenly individuals are spread among them. Measurement turns that definition into numbers. Richness is measured by counting species. Evenness is measured by comparing the abundance of each species with the others. Indices then combine the two into a single score that allows fair comparison between places, seasons, or years.
Why combine them at all? Because richness alone can flatter a site. A reserve might list one hundred species, but if ninety percent of all individuals belong to three species, the community functions more like a low-diversity system than the list suggests. Conversely, a site with fewer species in balanced proportions may be more stable and more resilient. The definition species diversity therefore demands both counts and proportions, and any index that ignores one half of the pair tells only half the story.
What a good measurement should do
A good diversity measurement should be repeatable, comparable, and honest about its limits. Repeatable means another team using the same method in the same place should get a similar result. Comparable means results from different places can be set side by side without hidden differences in effort skewing the outcome. Honest means the method states what it cannot see, such as rare species, night-active animals, or organisms too small to identify in the field.
Measuring Richness and Evenness in Definition Species Diversity
Species richness is the simplest measure: count the species observed. In practice, even this simple step needs care. Observers must agree on the area surveyed, the time spent, and the identification standard used. A longer survey almost always finds more species, so comparing a one-hour count with a full-day count is unfair. Ecologists therefore standardise effort, for example by surveying the same plot size for the same duration, or by using statistical tools that estimate how many species were probably missed.
Evenness is measured from abundance data: how many individuals of each species were found. If ten species each contribute about ten percent of individuals, evenness is high. If one species contributes eighty percent and the other nine share the rest, evenness is low. Simple charts, such as rank-abundance curves that plot species from most to least common, make this pattern visible at a glance. A steep curve means dominance by a few species; a gentle curve means a balanced community. Both patterns are central to the definition species diversity, and both are worth reporting rather than hiding inside a single number.
Sampling methods ecologists actually use
Field ecologists rarely count every individual in a landscape. Instead, they sample. Plant surveys use quadrats, which are square frames placed on the ground so that every plant inside can be counted or estimated. Insect surveys use pitfall traps, sweep nets, or light traps. Bird surveys use timed point counts, where an observer records every bird seen or heard from a fixed spot. Aquatic surveys use nets, kick sampling, or water samples tested for environmental DNA. Each method suits some groups better than others, which is why a full picture usually combines several methods.
Shannon and Simpson Indices for Definition Species Diversity
Two indices dominate textbooks and reports. The Shannon index rewards both richness and evenness, rising when more species are present and when individuals are spread evenly. It is sensitive to rare species, so the arrival or loss of an uncommon species moves the score noticeably. The Simpson index, by contrast, focuses more on dominance: it asks how likely it is that two individuals picked at random belong to the same species. A high Simpson diversity score means dominance is low and the community is well mixed.
Neither index is “correct” in isolation, and choosing between them depends on the question. A team tracking rare species may prefer Shannon, because rare species matter to their goal. A team worried about a single invasive species taking over may prefer Simpson, because dominance is exactly what they need to detect. Many reports present both, together with raw richness, so readers can see whether a change in the index came from losing species, from growing dominance, or from both. That transparency is good practice, and it reflects the definition species diversity in full rather than reducing it to one mysterious number.
Reading an index score without overclaiming
Index scores are most useful for comparison, not for absolute judgement. A Shannon score of 3.0 means little on its own; it gains meaning when the same site scored 2.2 five years earlier, or when a neighbouring site scores 3.8 under the same method. Scores also depend on the group studied: insects naturally produce different scores from large mammals, so cross-group comparisons are misleading. Always ask what was counted, how, and over what area before treating a score as a verdict.
Why Measuring Definition Species Diversity Matters
Measurement turns concern into decisions. Conservation budgets are finite, and a measured comparison can show which of two wetlands holds more species, which forest fragment is losing evenness fastest, or whether a restoration project is actually working. Without measurement, restoration success is judged by how green a site looks, which can hide a community dominated by a few fast-growing species. With measurement, success is judged by whether richness and evenness are genuinely recovering.
Measurement also creates early warnings. A falling index, driven by a few species becoming dominant, can signal pollution, overgrazing, or climate stress before species disappear entirely. At that stage, action is cheaper and more likely to succeed. Finally, measurement supports accountability: governments, charities, and companies that promise to protect nature can be judged against numbers collected the same way each year. The definition species diversity, measured well, becomes a public record rather than a slogan.
For readers interested in related topics, this site’s biodiversity-related guide offers further background, and the homepage links to many other plain-language explainers.
Comparing Common Diversity Measures
| Measure | What it captures | Strength | Limitation |
|---|---|---|---|
| Species richness | Number of species | Simple and intuitive | Ignores evenness |
| Evenness | Balance among species | Reveals dominance | Needs abundance data |
| Shannon index | Richness plus evenness | Sensitive to rare species | Hard to interpret alone |
| Simpson index | Dominance and mixing | Highlights takeover risk | Downplays rare species |
| Rank-abundance curve | Full abundance pattern | Shows shape at a glance | Not a single number |
The table shows why no single measure carries the whole definition species diversity on its own. Richness is the starting point, evenness adds balance, indices combine them, and curves show the pattern behind the numbers. A careful study reports several of these together, explains its sampling effort, and states its limits plainly.
Common Pitfalls When Measuring Species Diversity
Several traps can distort a diversity measurement. Unequal effort is the most common: surveying one site for a week and another for a day will almost always favour the first. Seasonal timing is another: a meadow surveyed in spring looks different from the same meadow in late summer, as different species flower or migrate. Identification skill matters too, especially for insects, fungi, and other groups where similar species are easy to confuse. Finally, rare and hard-to-detect species are systematically undercounted, which means published richness is usually a minimum, not a complete census.
Good studies reduce these traps by standardising effort, repeating surveys across seasons, using trained identifiers or DNA methods, and reporting uncertainty. Citizen science adds another layer of care: volunteers greatly expand coverage, but their records need checking, especially for unusual sightings. None of this makes measurement pointless. It makes measurement a craft, where method sections matter as much as headline scores.
Frequently Asked Questions About Measuring Definition Species Diversity
What is the easiest way to measure definition species diversity?
The easiest start is a standardised richness count plus a note on dominance: list the species found in a fixed area over a fixed time, and record roughly how common each one is. That simple pair already reflects the definition species diversity better than a species list alone, and it can be improved later with formal indices.
Do Shannon and Simpson indices give the same answer?
Often they move in the same direction, but not always. A site that gains rare species may rise on Shannon while barely changing on Simpson, while a site where one species becomes dominant may fall sharply on Simpson first. Reporting both avoids missing either kind of change.
Can diversity be measured from photographs or sound recordings?
Yes, increasingly so. Camera traps record mammals, acoustic recorders capture birds and amphibians, and image recognition helps sort large samples. These tools expand coverage, but they still need calibration against field observation, because each tool detects some species better than others.
Why does the definition species diversity need measurement at all?
Because without measurement, claims about diversity cannot be tested, compared, or tracked. Measurement converts the definition species diversity from an idea into evidence, and evidence is what guides protection, restoration, and honest reporting about whether nature is recovering or declining.
Conclusion: Measuring Definition Species Diversity Well
Measuring species diversity is not about producing a single impressive number. It is about counting species carefully, judging how evenly they are spread, combining those facts with indices used transparently, and repeating the process so change can be seen. The definition species diversity gives the concept; measurement gives it weight, comparability, and practical use in conservation.
Whether you are a student, a volunteer recorder, or simply a curious reader, the habit to take away is simple: ask how a diversity claim was measured. What area, what effort, what season, and which index? A claim that can answer those questions deserves trust. One that cannot is, at best, an impression waiting for evidence.