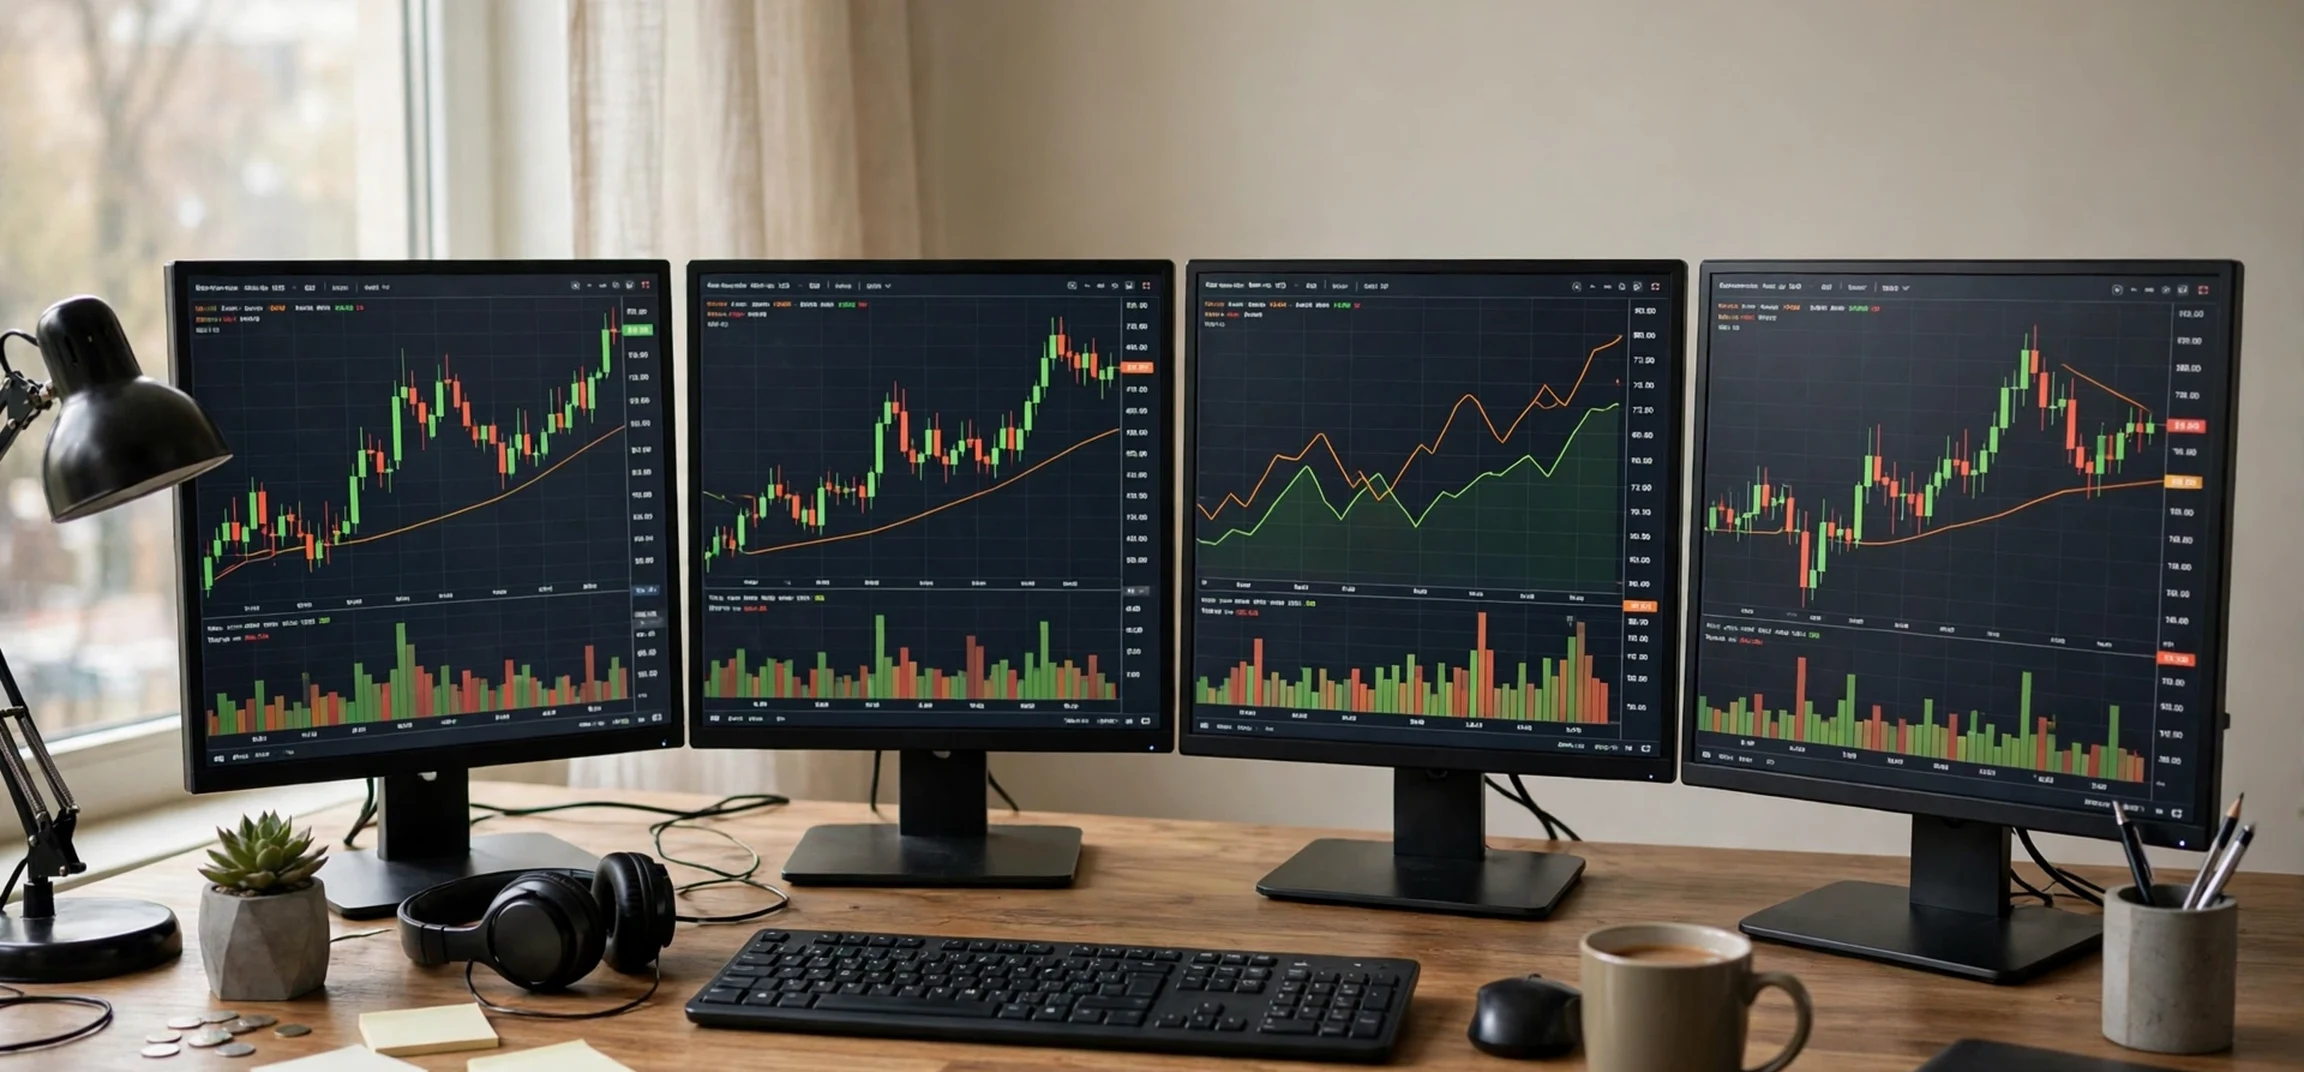
Day trading stock scanners are tools that help traders find stocks matching specific conditions during the trading day. Instead of manually checking hundreds of tickers one by one, a scanner filters the market in real time and shows only the stocks that meet your chosen rules. For example, a scanner might show stocks that have risen by more than five percent, stocks with unusually high volume, or stocks trading near a new daily high. When the results are presented clearly, without clutter and without confusing settings, traders call that experience crystal clear. This guide explains day trading stock scanners in plain language, how they work, what filters matter most, and how beginners can learn to use them safely.
This article is for education only. It does not provide financial advice, does not recommend any specific stock, and does not guarantee profits. Day trading involves significant risk, and many traders lose money. A scanner is a research tool, not a prediction machine. It can help you organise information, but it cannot tell you what will happen next. Anyone considering day trading should learn the basics, practise with paper trading or a demo account where available, understand fees and taxes, and only risk money they can afford to lose. If you are unsure, speak to a qualified financial professional before trading with real money.
The idea behind a scanner is simple. Markets move fast. News, earnings, analyst reports, and large orders can change a stock price in seconds. A human cannot watch every stock at once, but software can. A scanner checks price, volume, and other data continuously and updates a list as conditions change. The best scanners make that list easy to read at a glance. They use clear columns, sensible sorting, and colour cues that help you spot movement without feeling overwhelmed. A crystal clear scanner is not the one with the most features. It is the one whose results you can understand in seconds.
What A Day Trading Stock Scanner Does
A stock scanner starts with a universe of stocks, often thousands of listed companies. It then applies filters you choose. Common filters include price range, percentage change, volume compared with average volume, market capitalisation, exchange, and sector. Some scanners also filter by technical patterns, such as a stock crossing above its opening price, breaking a moving average, or forming a new high. When a stock passes all your filters, it appears on your results list. When it no longer passes, it drops off. That live updating is what makes scanners useful for day trading, where timing matters.
Think of a scanner like a sieve. You pour the whole market in at the top, and only the stocks that fit through your chosen holes come out at the bottom. If your holes are too wide, you get hundreds of results and no focus. If they are too narrow, you may get nothing at all. Learning to set filters is therefore a skill in itself. Beginners often start broad, observe what appears, and then tighten filters step by step until the list becomes manageable, often between five and twenty stocks at a time.
Scanners Versus Watchlists And Charts
A watchlist is a fixed list of stocks you choose to follow. A chart shows the price history of one stock. A scanner is different because it discovers stocks you were not already watching. That discovery role is valuable, but it also creates risk. A stock that appears on a scanner is not automatically a good trade. It may be moving because of news, a rumour, low liquidity, or a short-term spike that reverses quickly. A scanner should be the starting point for research, not the final decision. Always check the chart, the news, the volume, and the broader market before acting.
Good traders use scanners, watchlists, and charts together. The scanner finds candidates. The watchlist keeps track of stocks you are studying over several days. The chart helps you understand the pattern, support and resistance levels, and whether the move looks stable or erratic. Used this way, a scanner saves time without replacing judgement. Used alone, without further checks, it can lead to rushed decisions.
The Filters That Matter Most
Price is one of the first filters most day traders set. Some traders avoid very low-priced stocks because they can be volatile and costly to trade. Others avoid very high-priced stocks because position sizing becomes harder. There is no single correct price range. It depends on your account size, your broker fees, and your strategy. What matters is choosing a range you understand and sticking to it while you learn.
Volume is equally important. Volume tells you how many shares have traded. High relative volume means many traders are active in that stock, which usually makes it easier to buy and sell quickly. Low volume can mean wide spreads between buy and sell prices, and difficulty exiting a trade. Many scanners let you filter for volume above the average, or for a minimum number of shares traded. For learning purposes, focusing on liquid, actively traded stocks is generally safer than chasing thinly traded names.
Percentage Change, Momentum, And Gaps
Percentage change shows how much a stock has moved compared with its previous close. Day traders often scan for large gainers or large losers, because big moves attract attention and create trading opportunities. However, a big move alone does not explain why the stock moved. Always check for news, earnings, or corporate announcements. A gap occurs when a stock opens much higher or lower than its previous close. Gap scanners are popular in the first hour of trading, when overnight news is reflected in prices.
Momentum filters look at the speed and direction of recent movement. Examples include stocks making new highs, stocks crossing above a short-term moving average, or stocks with rising volume alongside rising price. These filters can help you find trends, but trends can reverse without warning. A clear scanner layout helps here because it shows whether momentum is building steadily or spiking in one sudden jump. Steady movement and sudden spikes require different thinking, and confusing them is a common beginner mistake.
What Crystal Clear Really Means
Crystal clear does not mean fancy graphics. It means you can answer three questions in seconds: which stocks match, why they match, and what has changed since you last looked. A clear scanner uses readable column headings, consistent sorting, and a limited number of columns. Too many columns force you to scroll sideways and miss movement. A good starting layout might include symbol, company name, price, percentage change, volume, relative volume, and daily high or low. You can add more columns later as you gain experience.
Clarity also comes from alerts that are specific rather than noisy. An alert that fires for every small move quickly becomes background noise. An alert tied to a precise condition, such as a stock crossing a price level with volume above average, is more useful. Many traders set only a handful of alerts and review them calmly, rather than reacting to every notification. If a scanner feels stressful to watch, it is probably showing too much information at once. Simplifying the layout is often more helpful than adding another filter.
Avoiding Common Scanner Mistakes
One common mistake is chasing every stock that appears. A scanner can produce new names all day, but trading every one of them leads to overtrading, higher fees, and emotional decisions. Experienced traders often limit themselves to a small number of trades per day and ignore most scanner results. Another mistake is using filters copied from someone else without understanding them. A filter that works for one trading style may not suit another. Take time to learn what each filter measures and test it in a demo environment first.
A third mistake is ignoring risk controls. A scanner does not set your position size, stop loss, or profit target. Those decisions are yours. Before any trade, decide how much you are willing to lose, where you would exit if you are wrong, and how large a position fits your account. Write those rules down and review them regularly. Tools can organise information, but discipline protects capital. No scanner, however clear, removes the risk of loss.
Building Your First Simple Scan
Start with a simple scan and build gradually. A beginner-friendly example might include stocks priced above a minimum you choose, with volume above average, and a percentage change beyond a threshold that interests you. Run the scan during market hours and watch how the list changes. Notice which stocks stay on the list and which appear and disappear quickly. Stocks that stay often have sustained interest, while stocks that flash briefly may reflect a one-time spike. Keeping notes on what you observe helps you learn faster than trading immediately.
Next, add one filter at a time. For example, add a sector filter to focus on technology or healthcare, or add a market capitalisation filter to focus on larger companies. After each change, observe the results for several sessions before adding another filter. This slow approach prevents confusion and helps you understand cause and effect. If a scan suddenly returns no results, check whether a filter is too strict rather than assuming the market is quiet. If it returns hundreds, tighten one filter at a time until the list is readable.
| Filter | What It Shows | Beginner Tip |
|---|---|---|
| Price range | Stocks within your chosen price band | Start with a range you can size comfortably |
| Relative volume | Volume compared with usual activity | Favour active stocks while learning |
| Percentage change | How far price moved today | Always check the news behind the move |
| New high or low | Stocks at daily extremes | Confirm with chart and volume before acting |
Using Scanners Without Overtrading
A scanner can make trading feel like a game, with new opportunities appearing constantly. That feeling is dangerous if it leads to constant trading. Set a routine. For example, check your scanner at set times, such as market open, mid-morning, and early afternoon, rather than staring at it all day. Between checks, review charts, read news, and update your notes. A routine reduces impulsive decisions and helps you see patterns over days and weeks rather than minutes.
Paper trading is a valuable step before using real money. Many brokers and platforms offer demo accounts where you can practise scanner-based research without financial risk. Use that period to test whether your filters produce ideas you understand, whether your risk rules are realistic, and whether you can stay calm when a trade moves against you. Keep a trading journal during this period. Record why a stock appeared, what you observed, what you decided, and what happened next. Over time, the journal becomes more educational than the scanner itself.
Choosing A Scanner Tool
When comparing scanner tools, focus on usability rather than marketing claims. Check whether data updates quickly, whether filters are easy to adjust, whether you can save layouts, and whether the tool works well on your device. Free scanners can be enough for learning, while paid tools may offer faster data, more filters, or better alerts. Do not pay for an advanced tool until you understand the basics and know which extra features you actually need. Also check broker compatibility, data delays, and whether prices shown are real time or delayed, because delayed data can mislead day traders.
For a broader view of everyday tools and how to choose them wisely, see our guide to Vanceai Cartoonizer Quick Access, which covers quick access and simple setup for a different kind of creative tool. The principle is the same: the best tool is the one you can use clearly and consistently, not the one with the longest feature list. You may also enjoy Chuck TV Show Cast Nostalgia Trip as a lighter read after a focused learning session.
Frequently Asked Questions
Do stock scanners guarantee profitable trades?
No. Scanners only filter market data. They do not predict future prices and do not guarantee profits. Trading involves risk, and losses are possible even with careful research.
What is the best filter for beginners?
There is no single best filter. A simple combination of price range, relative volume, and percentage change is a clear starting point for learning, provided you also check news and charts.
How many stocks should a scan return?
A manageable list is usually between five and twenty stocks. Hundreds of results are too many to study properly, while zero results may mean a filter is too strict.
Should beginners use real money immediately?
Most beginners benefit from learning and paper trading first. Take time to understand filters, risk controls, and market behaviour before risking real capital, and consider professional advice if needed.
Conclusion
Day trading stock scanners become crystal clear when you keep them simple, understand every filter, and use results as a starting point for research rather than as a trading signal on their own. Start broad, tighten slowly, favour liquid stocks while learning, check news and charts, and protect yourself with clear risk rules. Remember that this guide is educational only and does not promise returns. With patience, practice, and discipline, a scanner can help you organise a fast-moving market into a short, readable list. Without those habits, even the clearest scanner can encourage rushed decisions. Learn first, practise carefully, and let clarity, not speed, guide your approach.