If you searched for “satellite images of the south pole”, you are looking for pictures of Antarctica taken from orbit, and for an explanation of what those pictures actually show. The South Pole sits on a high, ice-covered plateau in the interior of Antarctica, and satellites are one of the few tools that can observe this remote region regularly, safely and at large scale. This guide explains how those images are made, what features they reveal, why the polar environment makes imaging difficult, and how scientists use the results to study ice, climate and the landscape beneath it.
Satellite imagery of Antarctica is not a single photograph. It is a collection of observations made by different instruments, at different wavelengths, over many years. Some images show the continent in natural colour, much as the human eye might see it from space. Others use radar or infrared sensing to reveal structure through cloud, darkness or snow. Together, they give researchers a picture of a continent that is difficult, expensive and often hazardous to survey on foot.
Satellite Images of the South Pole: What They Show
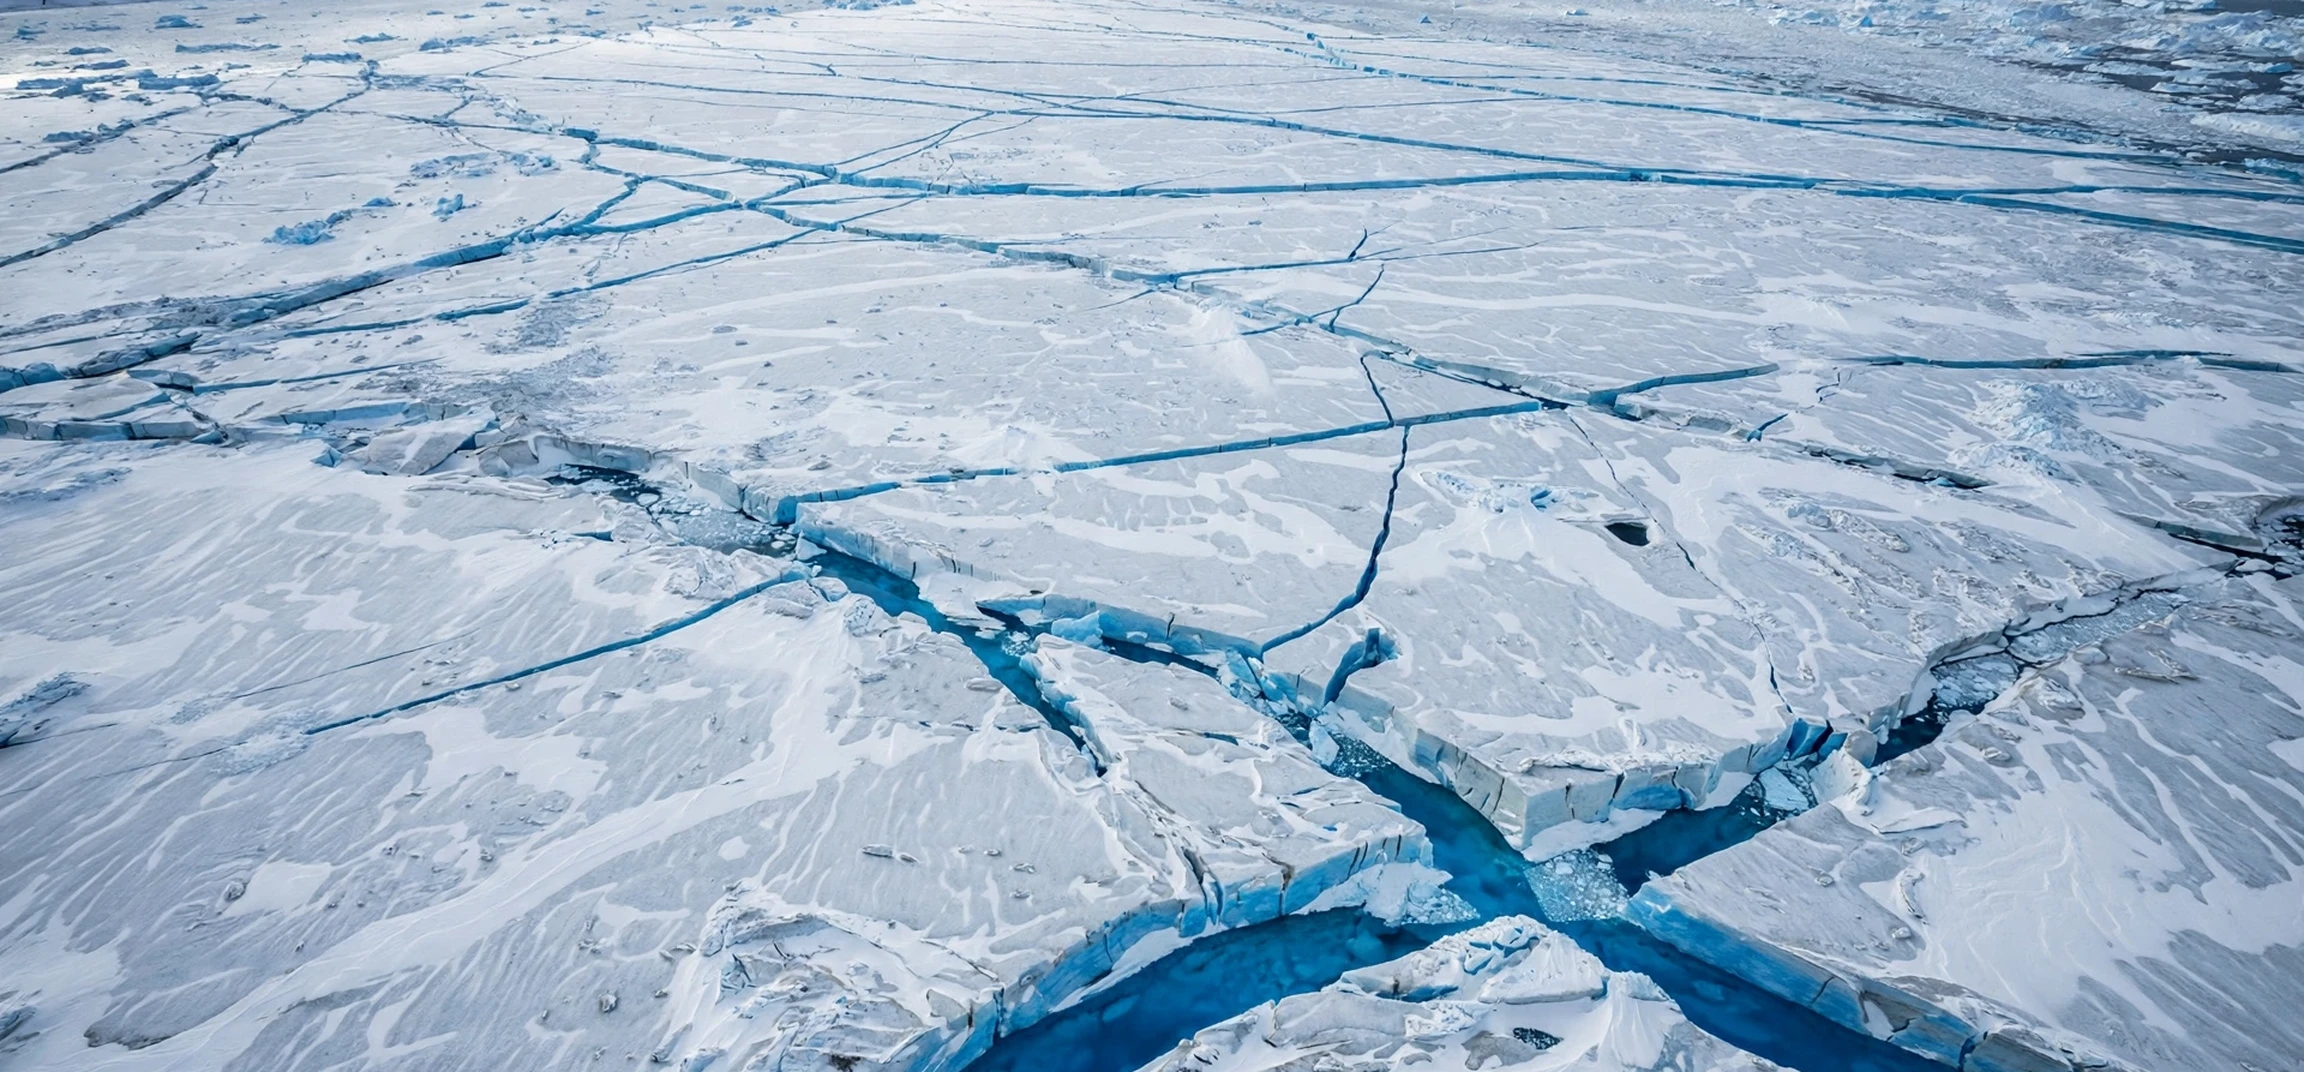
At first glance, satellite images of the South Pole can look surprisingly plain: a vast white expanse, broken by subtle shading, faint lines and occasional dark rock. That plainness is itself informative. The white surface is snow and ice, and the variations in brightness and texture record differences in snow grain, surface roughness, wind patterns and the direction of sunlight. Darker patches may indicate exposed rock, known as nunataks, where mountain peaks rise through the ice sheet.
Closer inspection reveals more structure. Long, curved lines can mark the flow of ice, as glaciers move slowly towards the coast. Cracks and crevasses appear as fine dark or bright features, depending on lighting and sensor type. Near research stations, small clusters of buildings, tracks and aircraft landing areas may be visible in high-resolution imagery, although the South Pole station itself occupies only a tiny area compared with the continent around it.
Seasonal change is another feature of these images. In summer, the Sun stays above the horizon for months, giving long periods of daylight for optical imaging. In winter, the region enters months of darkness, when optical cameras see little, and radar and other sensors become especially important. Comparing images across seasons and years helps scientists track changes in snow cover, ice movement and surface conditions.
Satellite Images of the South Pole: How They Are Made
Satellites that observe Antarctica follow polar or near-polar orbits, which carry them over high latitudes on each pass. This orbital design is essential, because a satellite in an equatorial orbit would never see the poles at all. Polar-orbiting satellites gradually cover the whole planet as the Earth rotates beneath them, building up a complete picture over days or weeks.
Different instruments produce different kinds of image. Optical sensors record reflected sunlight in visible and near-infrared wavelengths, producing familiar colour or false-colour pictures. Infrared sensors detect heat, which can help distinguish cloud from snow and ice. Radar sensors send out their own signal and record what bounces back, so they work in darkness and through cloud, and can reveal surface roughness and structure even in winter.
Resolution also varies. Some satellites provide broad, continent-wide views that are ideal for monitoring weather and large-scale ice patterns. Others provide detailed views of a small area, useful for studying a particular glacier, station or field site. Scientists often combine both: a broad view to place a feature in context, and a detailed view to examine it closely.
Why the South Pole is hard to image
Imaging the South Pole presents special challenges. The surface is extremely bright, which can overwhelm sensors designed for darker landscapes. Snow and cloud can look very similar in visible light, making it hard to tell where the ground ends and the sky begins. Low Sun angles in spring and autumn cast long shadows that can hide or exaggerate surface features. In winter, darkness removes optical light altogether.
Altitude is another factor. The South Pole lies at high elevation on the Antarctic plateau, where the air is thin, cold and dry. Instruments must cope with extreme cold, and data must be transmitted from a remote region with limited ground-station coverage. Despite these difficulties, decades of satellite observation have produced a remarkably detailed record of the continent.
The Landscape Beneath the Ice
One of the most remarkable uses of satellite data is to reveal what lies beneath the ice. The Antarctic ice sheet is, in places, kilometres thick, hiding mountains, valleys and lakes. Radar sounding, which is different from ordinary imaging radar, can penetrate ice and map the bedrock below. Gravity and magnetic measurements from orbit add further clues about the shape of the hidden landscape.
These sub-ice maps matter because the shape of the bedrock influences how ice flows and how it might respond to warming. Where bedrock slopes downwards towards the interior, ice can be more vulnerable to retreat once it starts to move. Where mountains block flow, ice may be more stable. Satellite-derived maps therefore help scientists understand not only what Antarctica looks like today, but how it might change in the future.
For background on how our planet itself is described and named, see our guide to how the planet Earth got its name. It places Antarctic observation in a wider context: the same planet that early map-makers struggled to chart is now monitored continuously from orbit.
What Scientists Learn From Antarctic Imagery
Satellite images support a wide range of Antarctic research. Glaciologists use repeated images to measure how fast ice streams move, by tracking distinctive surface features from one image to the next. A feature that shifts position over months or years reveals the speed and direction of ice flow, without any need for instruments on the ground.
Climate researchers use imagery to monitor snow and ice extent, surface melting and the behaviour of ice shelves, the floating extensions of the ice sheet. Changes in these features, observed over decades, provide evidence about how the Antarctic environment is responding to wider climate change. Because satellites observe the whole continent consistently, they avoid the gaps that would arise from relying only on scattered field stations.
Satellite data also supports logistics and safety. Maps derived from imagery help plan traverses across the ice, identify crevasse zones to avoid, and choose safe routes for aircraft and vehicles. In a region where weather can change rapidly and rescue is difficult, up-to-date imagery is a practical safety tool as well as a scientific one.
Types of satellite observation compared
| Sensor type | How it works | Strengths in Antarctica | Limitations |
|---|---|---|---|
| Optical | Records reflected sunlight | Familiar, detailed colour views | Needs daylight; confused by cloud |
| Infrared | Records heat and thermal differences | Helps separate cloud, snow and ice | Coarser detail than optical in some cases |
| Radar imaging | Sends a signal and records the return | Works in darkness and through cloud | Harder to interpret without training |
| Radar sounding | Penetrates ice to map bedrock | Reveals hidden landscape | Requires specialist processing |
| Laser altimetry | Measures height from reflected pulses | Tracks ice-surface elevation change | Narrow coverage compared with imaging |
Viewing South Pole Imagery as a Member of the Public
Members of the public can view many Antarctic satellite images through the online viewers and image galleries published by space agencies and research institutions. These platforms typically allow you to search by place, zoom in on a region, and compare images from different dates. Some offer natural-colour views, while others provide false-colour composites that highlight ice, rock or vegetation in other regions.
When viewing these images, it helps to check three things: the date of the image, the sensor that produced it, and the scale. An image taken in summer will look very different from a radar image taken in winter darkness, even if it shows the same place. A broad, continent-wide view will hide small features that a detailed view reveals. Reading the caption and metadata, rather than judging the image alone, gives a much more accurate understanding.
It is also worth treating dramatic claims about a single image with caution. A striking pattern in snow, a dark patch or an unusual shadow is usually explained by ordinary ice, rock, light or sensor effects. Reputable agencies publish explanations alongside their imagery, and checking those explanations is the best way to avoid misunderstanding what you are seeing.
Frequently Asked Questions
Can satellites see the South Pole station itself?
Yes, in high-resolution imagery the station buildings, tracks and related infrastructure can be visible, although they are very small compared with the surrounding ice sheet. Broader images may show only the general location, marked by the station’s position on the plateau.
Why do some Antarctic satellite images look blue or red?
Many published images are false-colour composites, in which wavelengths beyond human vision are displayed as visible colours to highlight particular features, such as ice type, cloud or rock. The colours are a visualisation choice, not a literal photograph.
Do satellites work during the Antarctic winter?
Optical cameras are limited by months of darkness, but radar and other active sensors continue to operate, because they provide their own illumination. This is why winter monitoring relies heavily on radar.
Is Antarctica melting, according to satellite data?
Satellite records show complex, regional patterns rather than a single simple story. Some areas have lost ice, others have shown different trends, and scientists analyse long-term records from multiple sensors to understand the overall picture. For current assessments, consult the published findings of reputable research institutions and space agencies.
Conclusion
Satellite images of the South Pole turn one of the most remote places on Earth into a landscape that can be studied, mapped and monitored from orbit. They reveal ice flow, hidden bedrock, seasonal change and the small footprint of human research in a vast white continent. Used carefully, with attention to date, sensor and scale, they are a powerful educational tool as well as a scientific one. For a wider perspective on the planet these satellites observe, see our companion guide on an Earth-related phrase, and keep returning to official agency galleries for the latest verified imagery.